
Plain data is boring. But visualization of the same data is cool and interesting. If your web application ever deals with even a small set of data, you may be using charts already to display them. If you aren’t, you should start using them.
Drawing charts on a canvas isn’t an easy job and will require a lot of your time. Let me list 4 of my favorite JS library to plot graph and charts and make your life easier.
1. Chart.JS
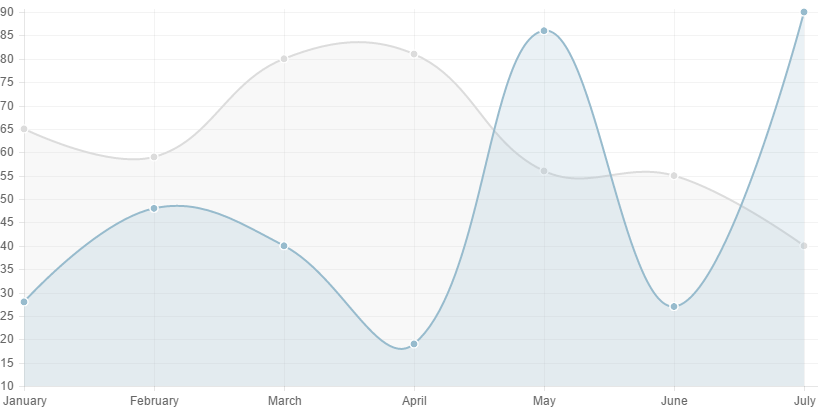
Chart.js is a very simple and easy to use library to plot charts. It’s pretty light weight and supports following 6 types of charts:
- Line
- Bar
- Radar
- Polar Area
- Pie
- Doughnut
Chart.JS creates beautiful responsive charts and has sufficient set for APIs and a neat documentation.
Link: Chart.JS
2. Morris.JS
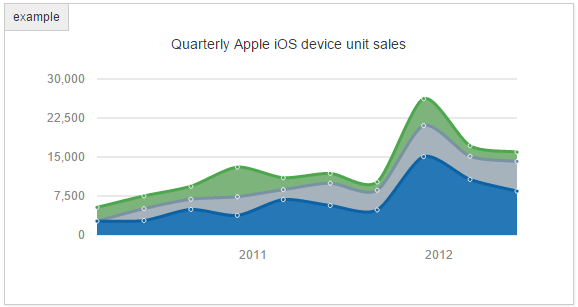
Morris.js is very similar to Chart.JS and creates pretty charts. Main difference between them is that Chart.JS uses canvas element to plot charts while Morris.JS uses SVG. However Morris.JS supports slightly fewer types of charts:
- Line
- Area
- Bar
- Donut
Link: Morris.JS
3. Flot
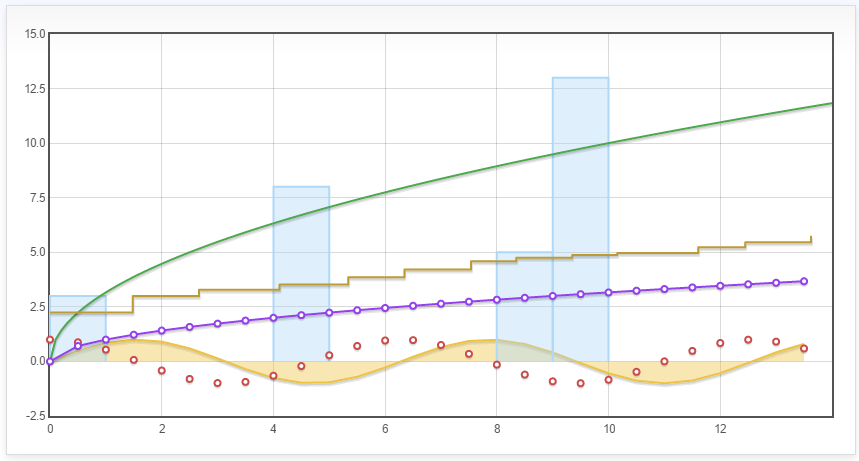
Flot is a very extensive chart plotting library that draws interactive chats and has several options and features. If you require extensive and comprehensive graphs, use nothing but Flot.
If your web app contains real-time interactive graph, this library will fit your need.
Link: Flot
4. jQuery Sparklines
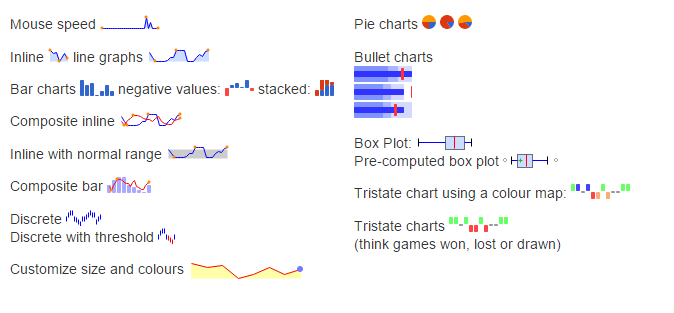
This jQuery based library is the best choice when it comes plotting inline charts. It plots very beautiful inline chart. You can use it to get small charts in a text line or paragraph.
It supports following types of charts:
- Line
- Bar
- Stacked
- Discrete
- Pie
- Tristate
- Box
- Bullets
Link: jQuery Sparklines